Improving hull performance through IoT

Wilhelmsen insights
|
Paal Berg Lande, Fleet Manager - Cruise Segment, Wilhelmsen Ship Management
There are many ways to reduce fuel usage and carbon emission. From the conventional way of hull cleaning and propeller polishing, to design modifications and renewable/alternate sources of energy, the industry is constantly evolving to achieve results. The question is: How can we prove real economic value?
Industrial Internet of Things
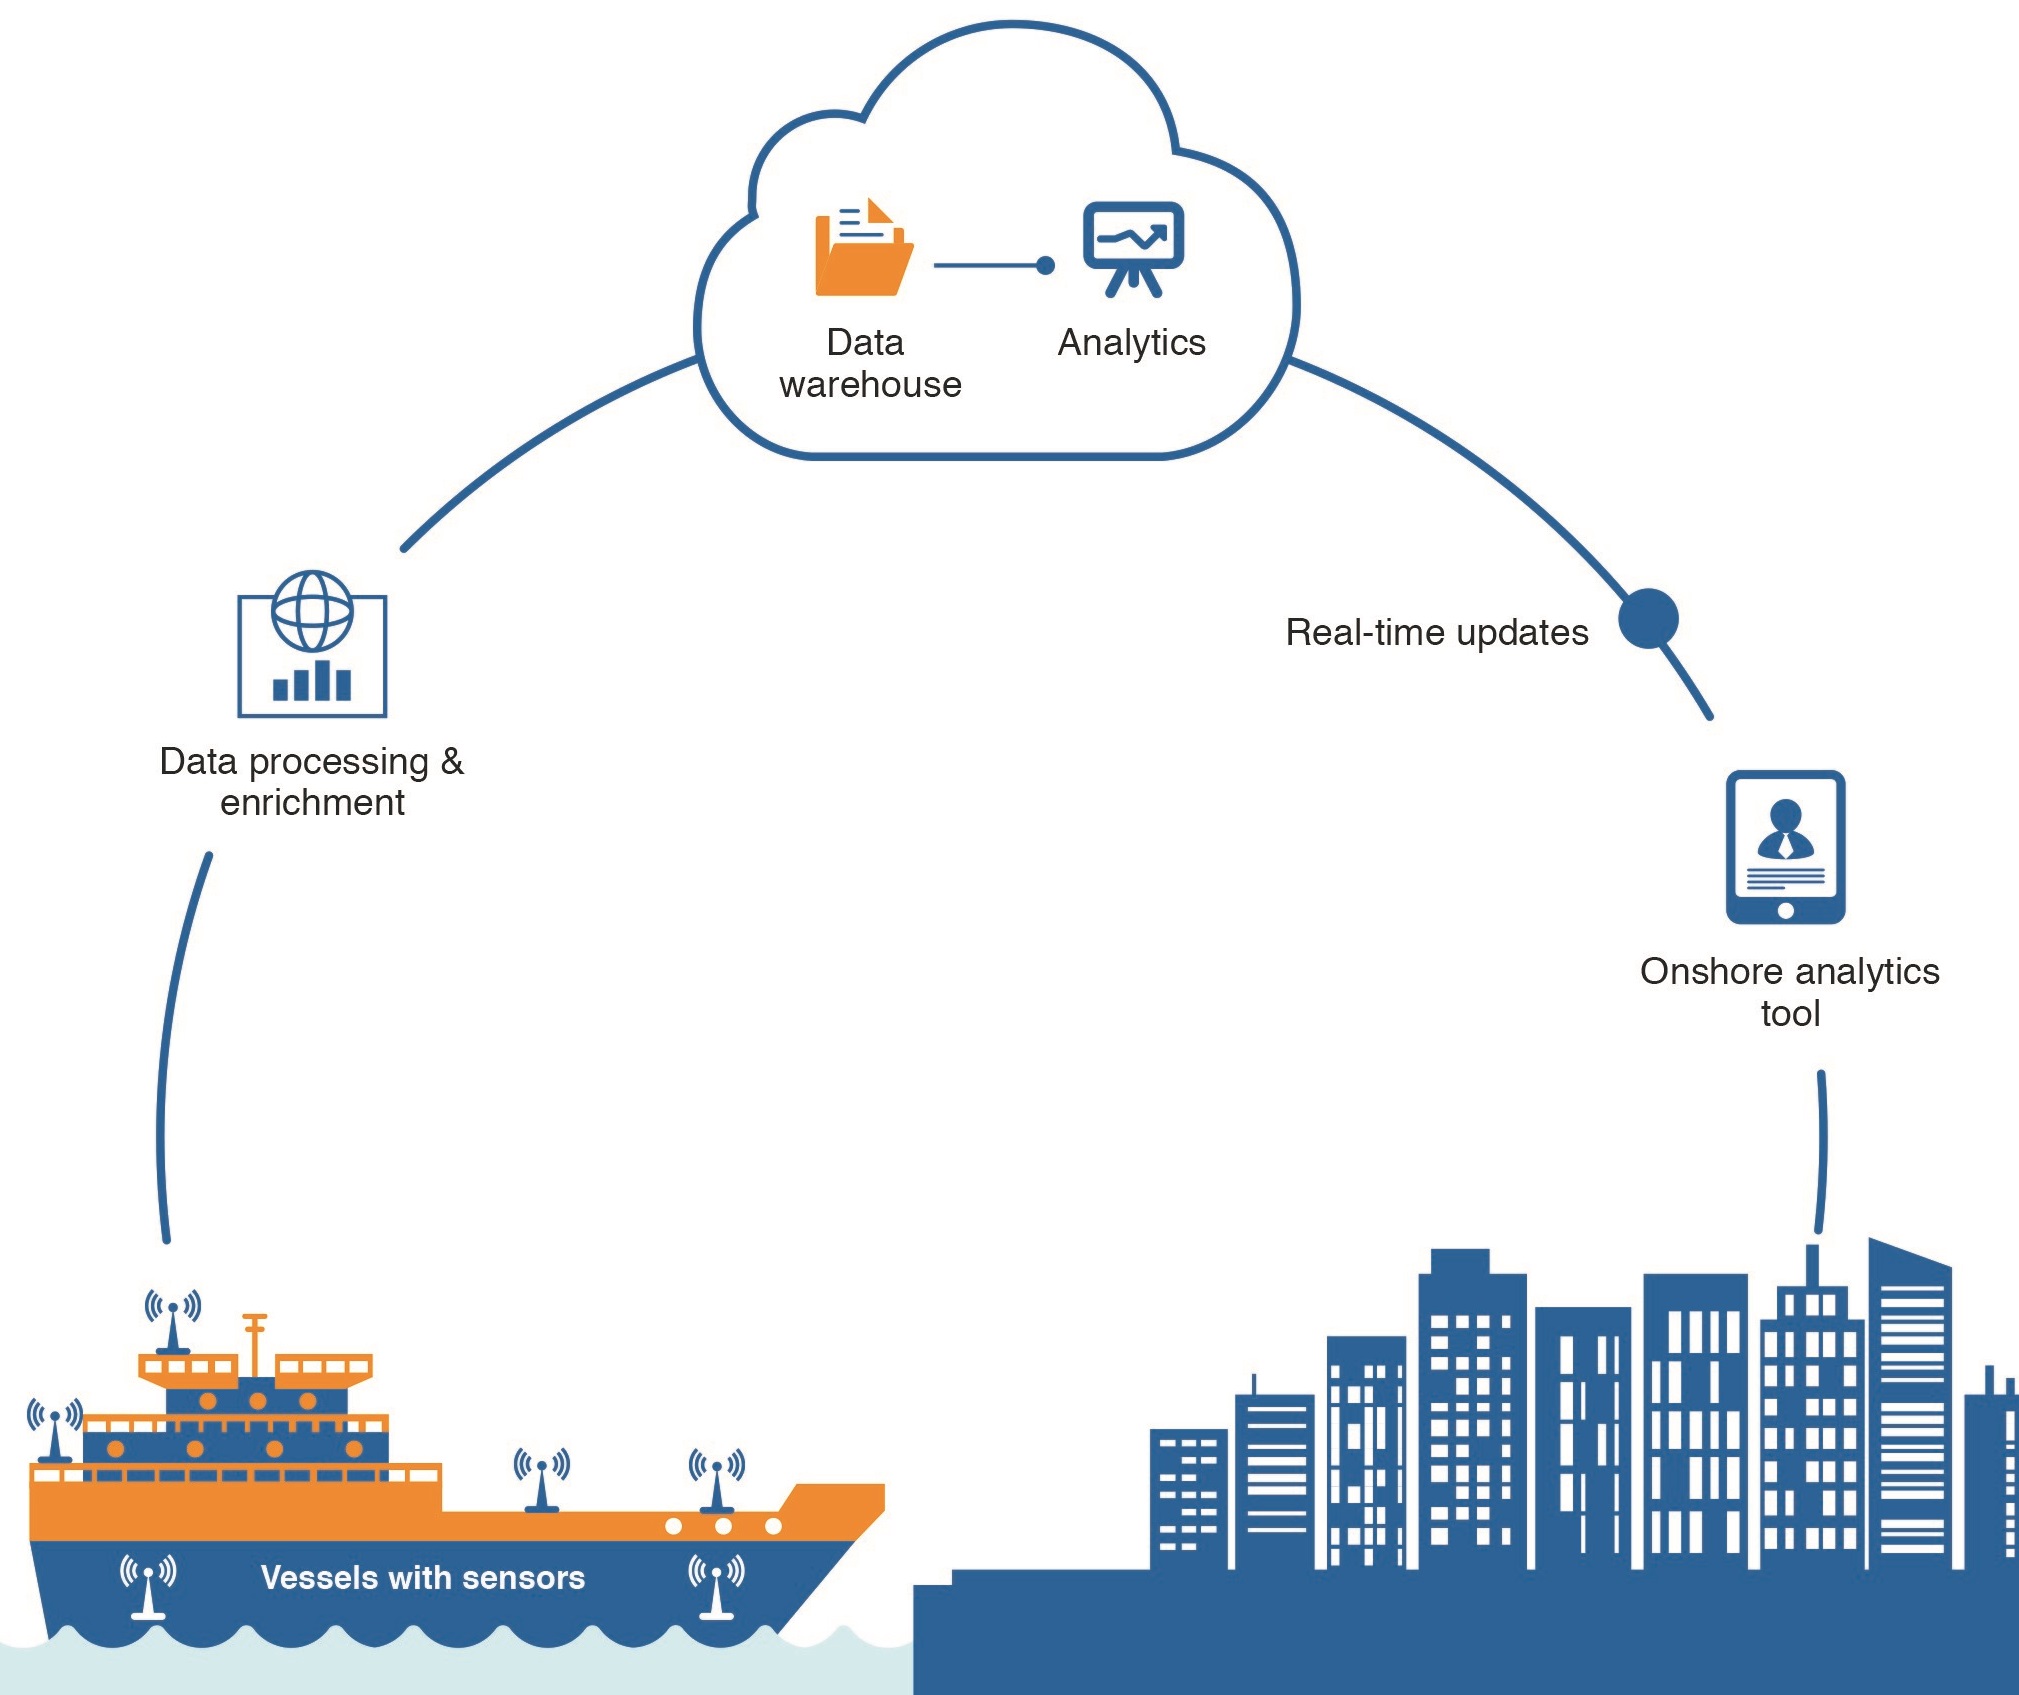
As smart cars trail the land, smart ships have also set its sail at sea. WSM has lately been working with ships equipped with sensors collecting high frequency data. A wide array of sensors' data from the ship is transmitted to our data warehouse. This data is further utilized in analytical processes and algorithms to provide tangible information and decision support tools.

The access of data has made it possible for us to design our own hull performance tool that enables us to monitor the ship’s hull and propeller performances over time. The performance analysis is based on the high frequency sensor data of everything from propulsion power output, rpm and speed to wind and current speed, wave height and trim.
This provides an exact, quantifiable measurement of changes in ship resistance and the impact on speed or power before and after major events such as dry docking, hull and propeller cleaning. Economic value of these major events are easily quantified and measured by analyzing the before-and-after effects.
Conditional based hull maintenance
This hull performance decision support tool also let us know when we should perform hull cleaning or paint system inspections. By gauging the measurement of ship resistance, we can optimize the timing of hull cleaning to maintain efficient hull performance.

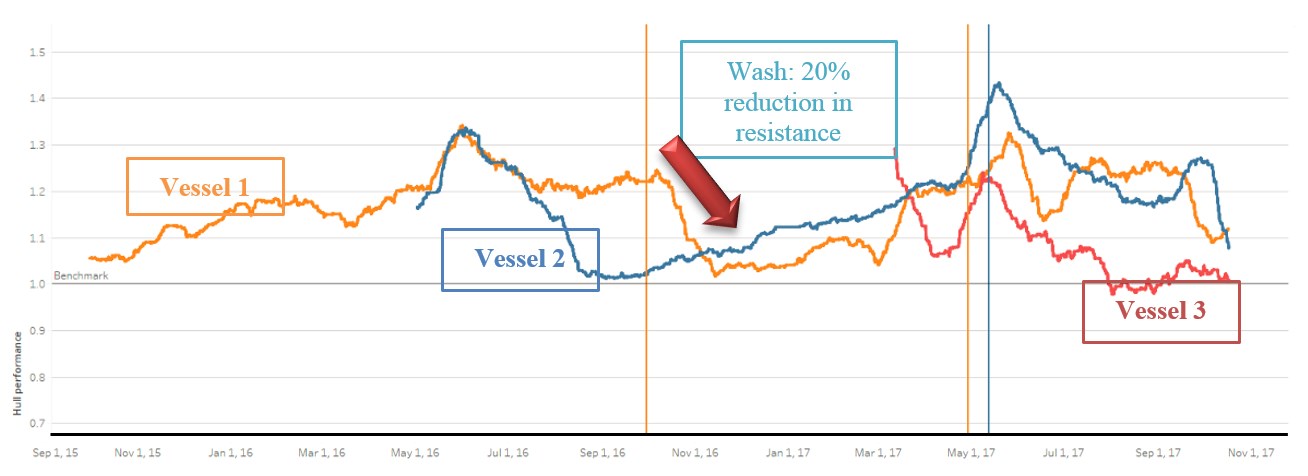
Diagram above shows the calculation of ship resistance for a fleet of sister ships. The Y-axis indicates added resistance multiplied with the baseline. This means, if the line hits 1.0 there is zero added resistance and vessel is “as new”. If the line hits 1.1 there is a 10% added resistance, and in simplified terms represents 10% added fuel consumption. As seen, a few days after a cleaning (for instance the first cleaning for Vessel 1), there is a drop from 1.2 to close to 1.0.
As ship resistance measurement peaks, hull cleaning is planned and performed at the right timing and location. By doing this the right way and at the right time, we can help Owners/charterers save large amounts of fuel. It is evident in the diagram that by optimizing the timing of hull cleaning we were able to reduce fuel consumption of one vessel by 20%, which if for instance considering 30 tons HFO per day, equates to saving of US$1,800 per day (fuel cost ~300/ton).
This is one area where we see IoT is changing dynamics and breaking down barriers. New tools, bigger data sets and changing customer expectations are the new normal for ship managers to remain in the game.
Paal Berg Lande - Fleet Manager, Cruise Segment, Wilhelmsen Ship Management
Upcoming Initiatives
Commodity Planner
A graphical geographic overview of all upcoming ports that highlights relevant costs such as fresh water, garbage landing and sludge landing. This enables advanced planning for expenses and reduce running costs.
Voyage Planning Tool
This tool aims to provide the master and chief engineer with guidance when planning a voyage, giving recommendations related to optimal speed and engine configuration for each leg. Historical vessel performance data is analysed at depth based on engine configuration and characteristics, potentially saving considerable amounts of fuel.